
Case Studies

The data made the call.
The streams followed.

Campaigns where a read of the numbers changed the decision: which track to push, which market to enter, which city to book. Same loop every time. Test, read, move budget to what works.

2B+

Streams on a single campaign

140M+

Streams from a mid campaign pivot

134M+

Streams from an unclaimed market

20M+

Streams turned into a US tour

Selected work

Every campaign, start to finish

Each one shows the challenge, what we did with the data, the outcome, and the exact sequence the campaign ran in.

Justice and Tame Impala photographed outdoorsCampaign pivot

Grammy Winners 2024

Justice & Tame Impala

A data driven mid campaign switch unlocked a global viral moment

PromoteConvertRepeat

140M+

Streams

Millions

TikTok creations

Grammy

Win in 2024

The challenge

Tasked with the global rollout of a high profile collaboration, the team was operating on intuition about which track deserved the most marketing investment. With multiple strong contenders and limited budget, a wrong call could cost millions of potential streams.

The approach

We aggregated real time social signal across TikTok, Spotify and Instagram. While 'One Night/All Night' was the designated lead single, 'Neverender' was quietly accumulating superior momentum: more saves, higher completion rates and accelerating fan made content. The shift surfaced in the data before anyone had noticed it in the room.

The result

The team made the call to redirect the primary campaign focus mid rollout. Budget was reallocated, pitching was reprioritised and paid social shifted to 'Neverender'. The outcome was a global viral success that beat initial projections, driven entirely by analytics rather than gut feeling.

How the campaign ran

01

Signal

TikTok, Spotify and Instagram read together in real time

02

Read

Saves, completion rate and fan content flagged the wrong lead single

03

Pivot

Budget and paid social reallocated mid rollout

04

Scale

Winning track pushed globally on proven demand

Figures reported from the campaign's Spotify for Artists and Meta Ads Manager exports, shared with the client throughout the rollout.

Open the full breakdown


Ava Max portraitTerritory intelligence

929 Management

Ava Max

Territory level insight powered the campaign behind a 2B stream hit

PromoteConvertRepeat

2B+

Streams on Spotify

Global

Viral reach

Data led

Territory rollout

The challenge

With 'Sweet But Psycho' showing early promise, the team needed to know exactly where to invest: which territories, which platforms and which audiences carried the highest potential for viral lift. Spreading budget evenly across every market would have diluted the impact.

The approach

We analysed streaming behaviour, social engagement and playlist traction across dozens of territories, then ranked markets by organic momentum and cost per engaged fan. That produced a specific rollout order: which cities to target, which creative angles resonated locally and how to sequence spend.

The result

The campaign was built entirely on that territory ranking. The song spread market by market in the exact sequence the data predicted and reached global viral status.

How the campaign ran

01

Map

Dozens of territories scored on momentum and cost

02

Rank

Markets ordered by cost per engaged fan

03

Localise

Creative angles matched to each market

04

Sequence

Budget released market by market, not all at once

Figures reported from the campaign's Spotify for Artists territory reporting and Meta Ads Manager exports, shared with the client throughout the rollout.

Open the full breakdown

BLOND:ISH photographed outdoors in sunglassesMarket discovery

Independent artist

BLOND:ISH

A hidden LATAM viral signal converted into global streaming momentum

PromoteConvertRepeat

134M+

Global streams

LATAM

Led the growth

Tier 2/3

Markets entered early

The challenge

A loyal global fanbase existed, but marketing focus stayed anchored to the US and Western Europe. Emerging traction elsewhere was going unnoticed, leaving real growth on the table.

The approach

Our territory layer picked up an early stage viral signal building in Latin America, in Tier 2 and Tier 3 markets that were not part of the active campaign. Stream velocity, playlist adds and social engagement were accelerating in the pattern that usually precedes a breakout. We moved a modest budget into those markets before the wave peaked.

The result

Entering LATAM early and cheap built a global streaming profile that caught the attention of algorithmic playlists and label partners worldwide. That international volume then triggered accelerated growth back in the US, the exact market originally prioritised.

How the campaign ran

01

Detect

Rising velocity spotted outside the planned markets

02

Verify

Playlist adds and social engagement confirmed the pattern

03

Enter early

Modest budget deployed before cost rose

04

Reflect back

International volume lifted the US market

Figures reported from the campaign's Spotify for Artists territory reporting and Meta Ads Manager exports, shared with the client throughout the rollout.

Open the full breakdown

Noga Erez portraitMulti platform growth

Atlantic Records

Noga Erez

Streaming growth and social strategy aligned to power a US tour

PromoteConvertOwnMonetize

20M+

Streams across promoted tracks

USA tour

Successfully executed

City level

Venue selection

The challenge

Atlantic Records needed to build a US presence ahead of an American tour. The hard part was converting streaming listeners into real, geo located fans who would actually show up to venues, across Spotify and Instagram at the same time.

The approach

We tracked listener growth and geographic concentration across Spotify for tracks including 'Dumb' and 'Vandalist', identified the cities with the strongest fan density, and ran targeted Reels campaigns to amplify visibility in exactly those markets. Touring readiness was assessed city by city before anything was booked.

The result

The coordinated Spotify and Instagram strategy built real audience density in key US cities before the tour was announced. Listener heatmaps informed venue selection directly, so the rooms matched the demand.

From day one, the campaign attracted high-quality listeners, leading to steady growth. Remarkably, it triggered the Spotify algorithm within just two days, amplifying our reach.
Noga Erez, Artist, Tel Aviv, Israel

How the campaign ran

01

Track

Listener growth mapped by city on Spotify

02

Concentrate

Highest density markets identified

03

Amplify

Reels campaigns run into those cities only

04

Book

Venue size matched to proven fan density

Figures reported from the campaign's Spotify for Artists and Meta Ads Manager exports, shared with the client throughout the rollout.

Open the full breakdown
Tim McGraw portraitFan mobilisation

EM.Co Management

Tim McGraw

Streaming data repurposed to mobilise fan voting at the People's Choice Awards

PromoteOwnMonetize

Voted in

People's Choice Awards

Unified

Audience intelligence

Dual

Campaign execution

The challenge

Management needed to grow streaming presence for 'One Bad Habit' and mobilise the fanbase for a People's Choice Awards voting campaign at the same time. Two objectives, different tactics, one audience.

The approach

We unified Spotify listener data, audience demographics and engagement patterns into a single intelligence layer, isolated the highest value fan segments by age, geography and listening frequency, then built both a Spotify ad strategy and a fan activation playbook off the same data set.

The result

The paid campaign drove meaningful listener growth for the single while the activation mobilised core supporters to vote. One data set powering two coordinated campaigns cut cost and time on both.

We were happy with the significant growth achieved in just the first month of promoting the single. Encouraged by these results, we are now expanding our campaigns to even broader packages.
Tim McGraw camp, Client, Nashville, Tennessee

How the campaign ran

01

Unify

Listener data, demographics and engagement in one layer

02

Segment

Highest value fans isolated by age and geography

03

Split

One data set feeding paid growth and fan activation

04

Convert

Streams up, votes in, on the same budget

Figures reported from the campaign's Spotify for Artists and Meta Ads Manager exports, shared with the client throughout the rollout.

Open the full breakdown
Aviram photographed with a guitar in a red jacketZero to scale

Independent rock artist

Built from zero, indie budget

Aviram

From zero streams to a proven cost per stream of half a cent

PromoteConvertRepeat

2.5M+

Streams in 12 months

$0.0056

Cost per stream

192,770

Saves

Started

March 2023

Daily budget

$20 to $50

Platform

Spotify

Method

Hyper A/B testing

The challenge

Aviram came to us in March 2023 as a rock artist with no streaming history and no paid media in place. Rock is a hard genre to buy attention in, and the budget was modest: twenty to fifty dollars a day, roughly one thousand dollars a month.

The approach

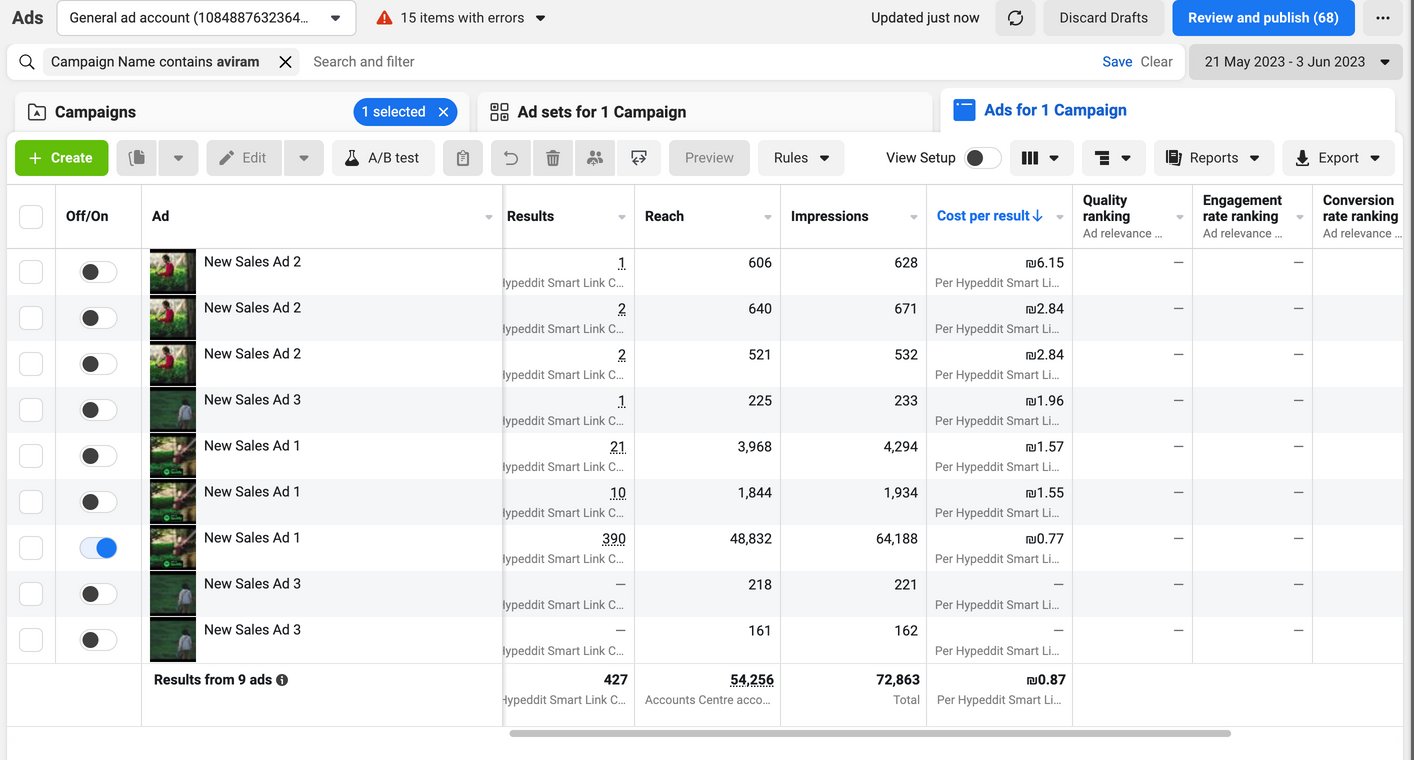
We ran our hyper A/B testing method from day one. Creatives, hooks and audiences were rebuilt weekly, spend followed the variants that produced the cheapest qualified click, and every result was read inside Spotify for Artists rather than in ad manager alone.

The result

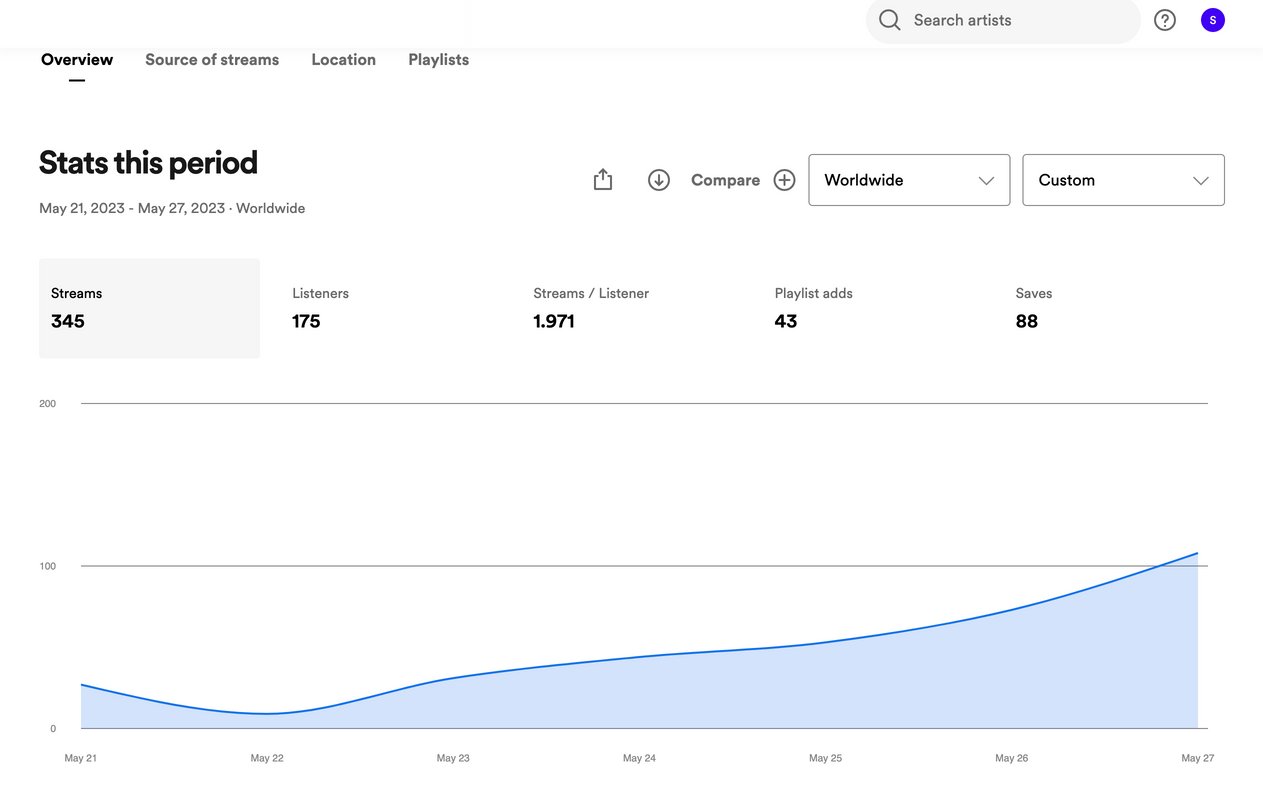
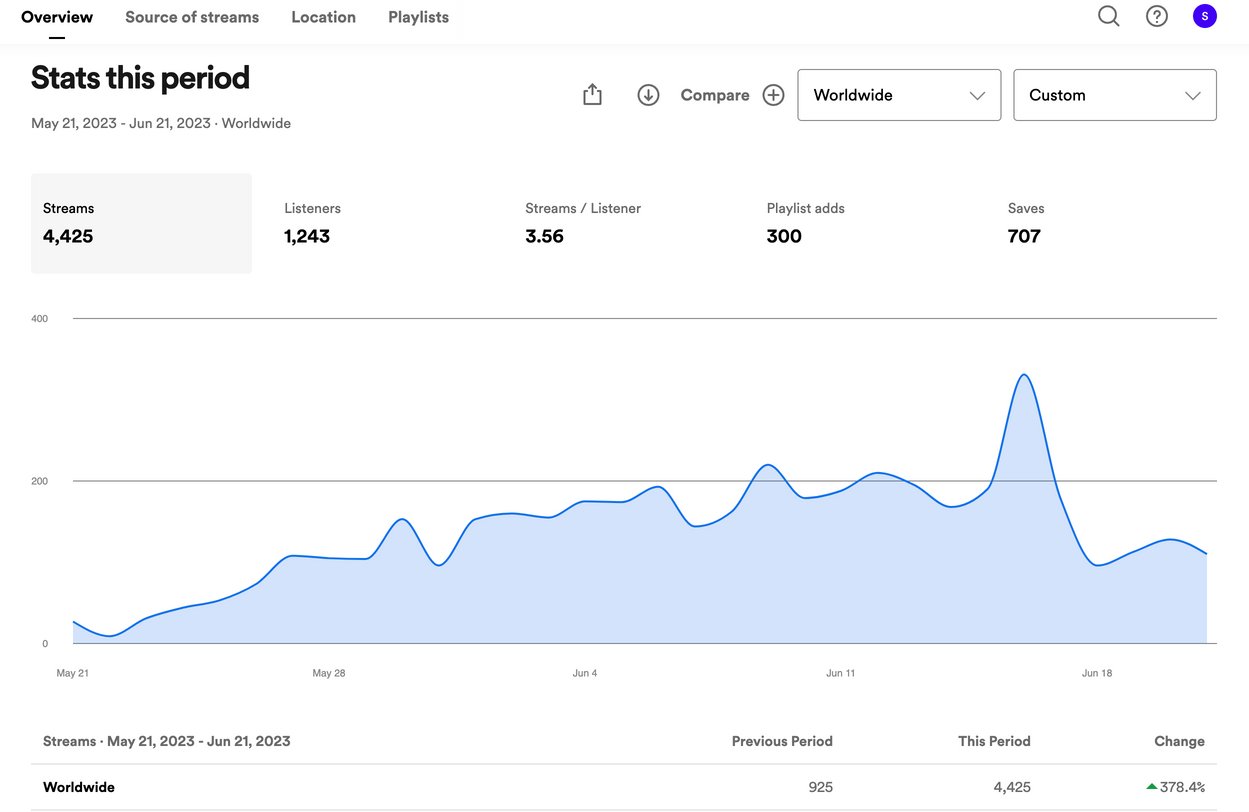
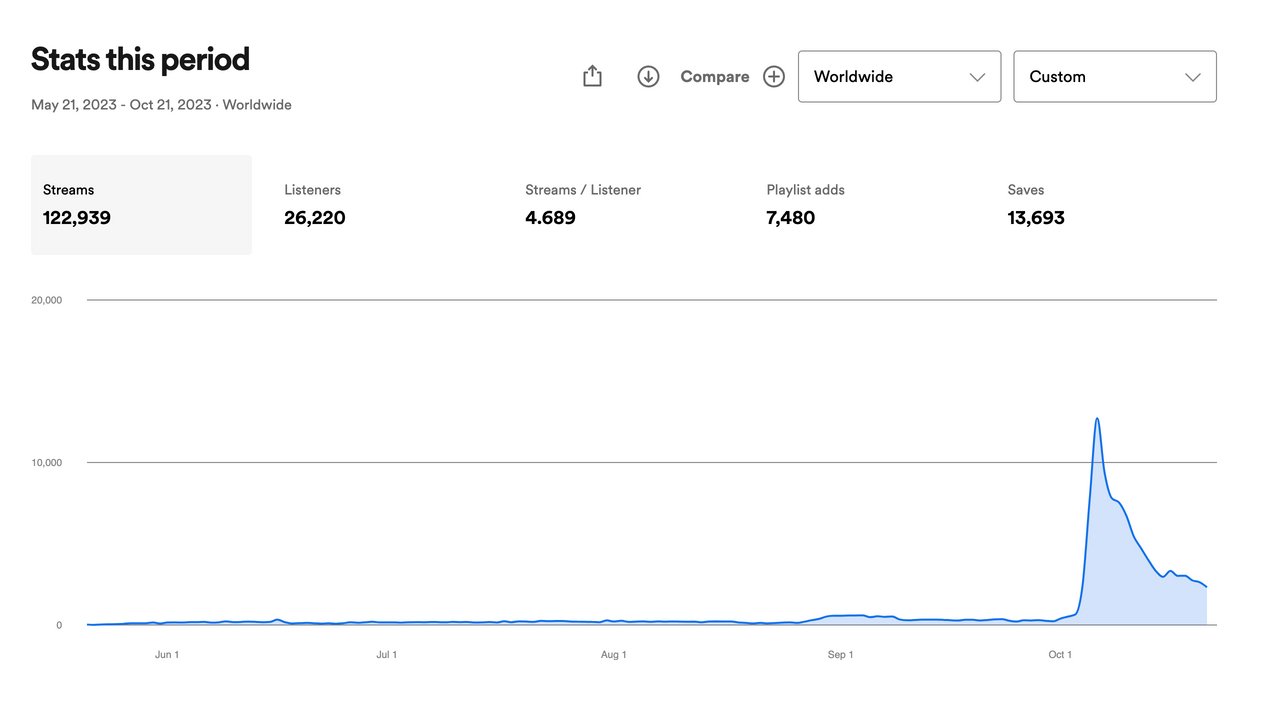
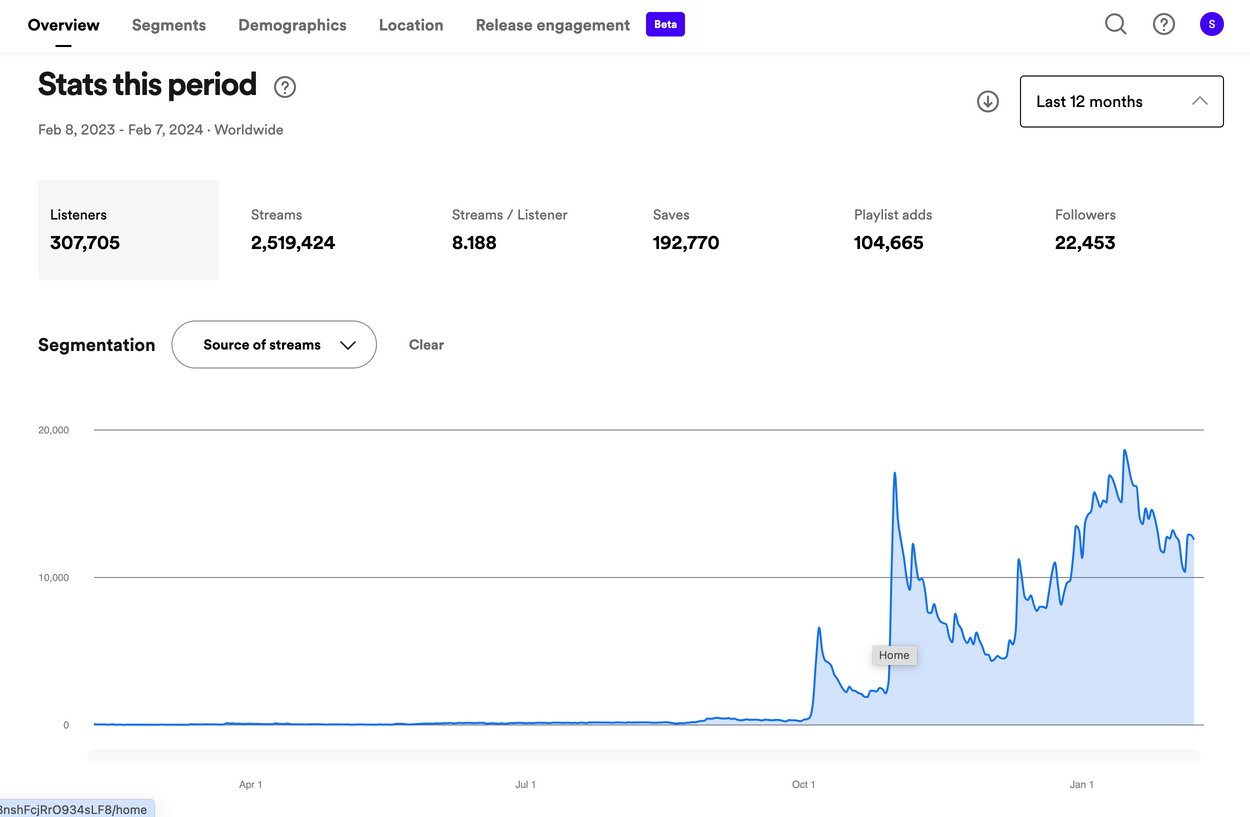
Week one produced 345 streams at eleven cents each. By month five the same method had compounded into 122,939 streams at a cost per stream of $0.0056, and the twelve month view shows over 2.5 million streams with 192,770 saves and 104,665 playlist adds.

Straight from the campaign

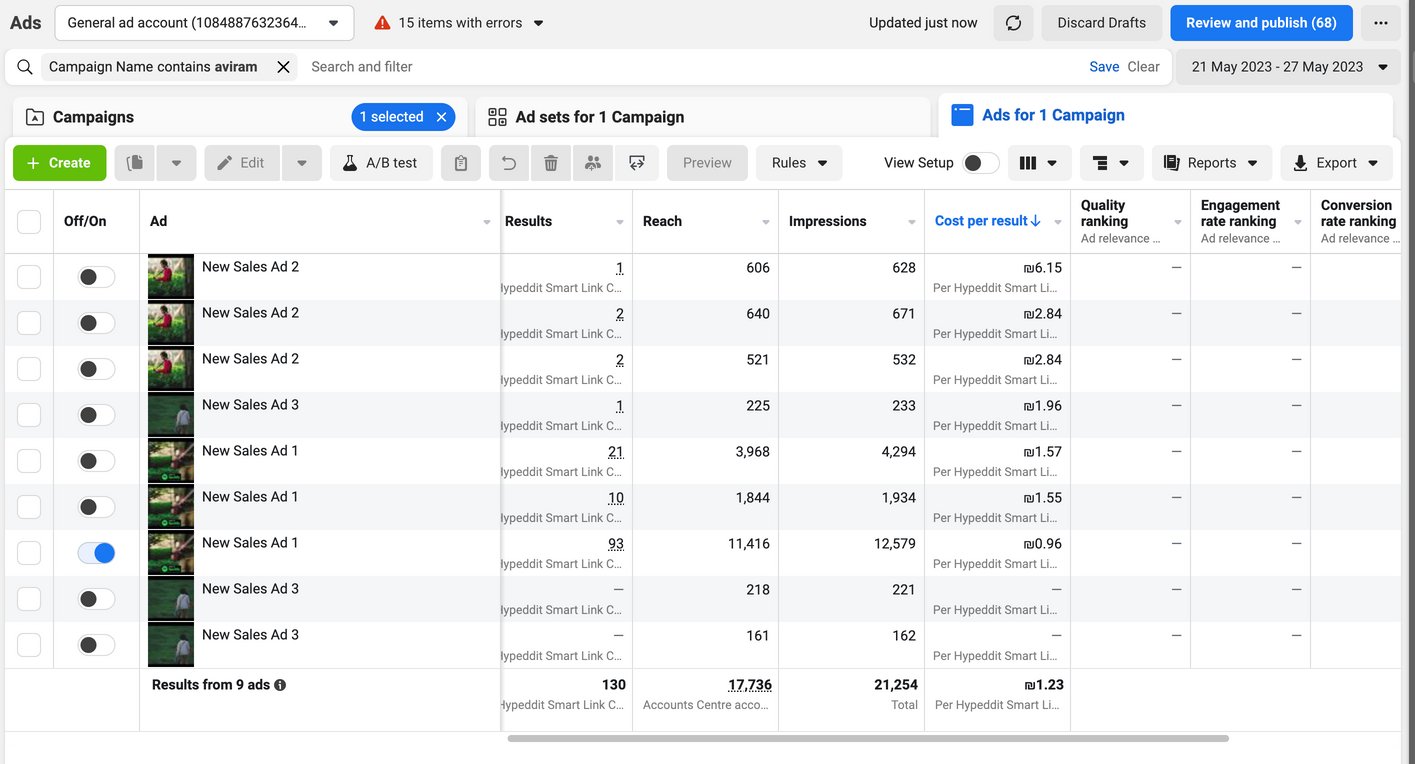
Meta ads manager results for week one
Week one, ad level results
Spotify for Artists stats after one week
Week one, 345 streams
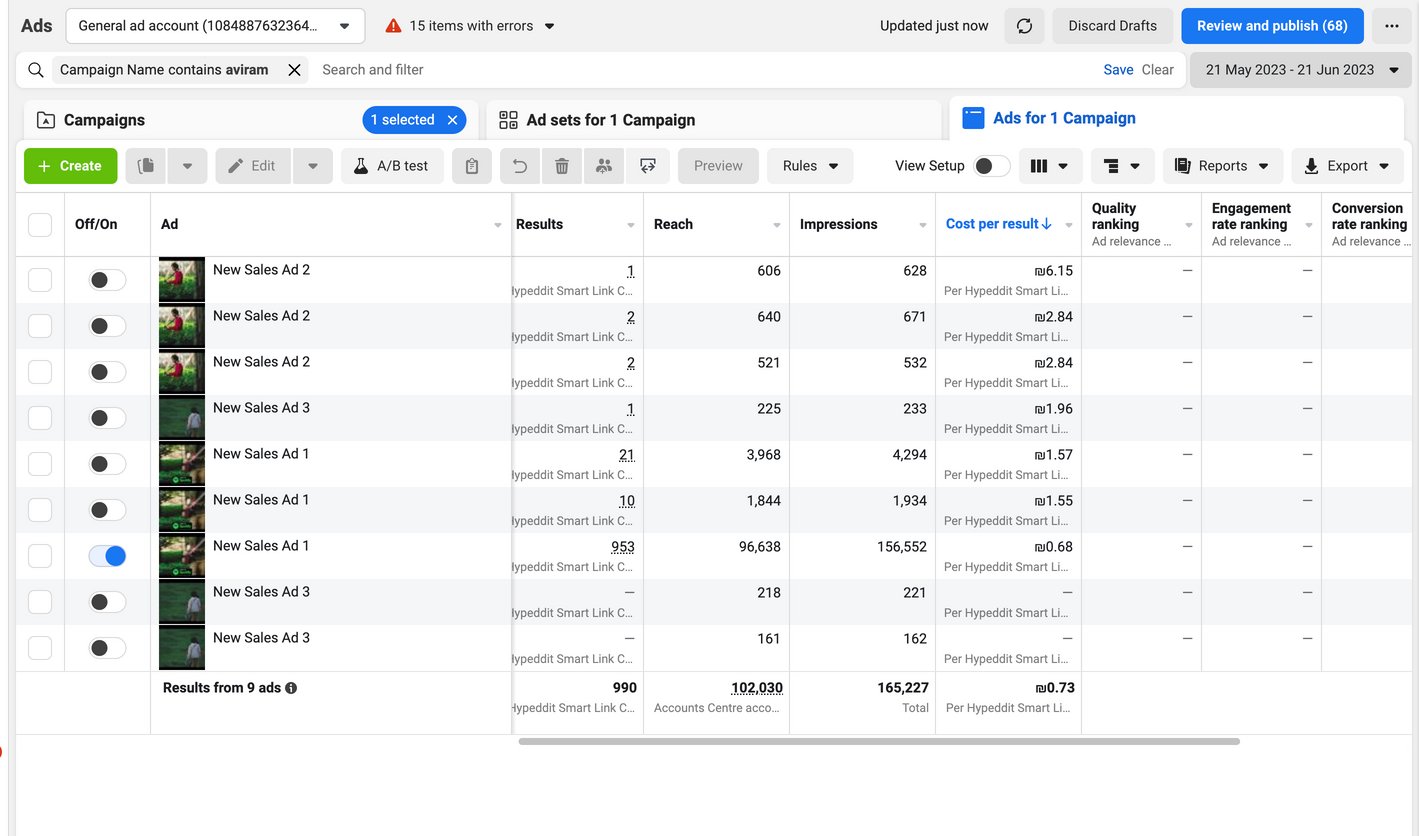
Meta ads manager results for week two
Week two, spend follows winners
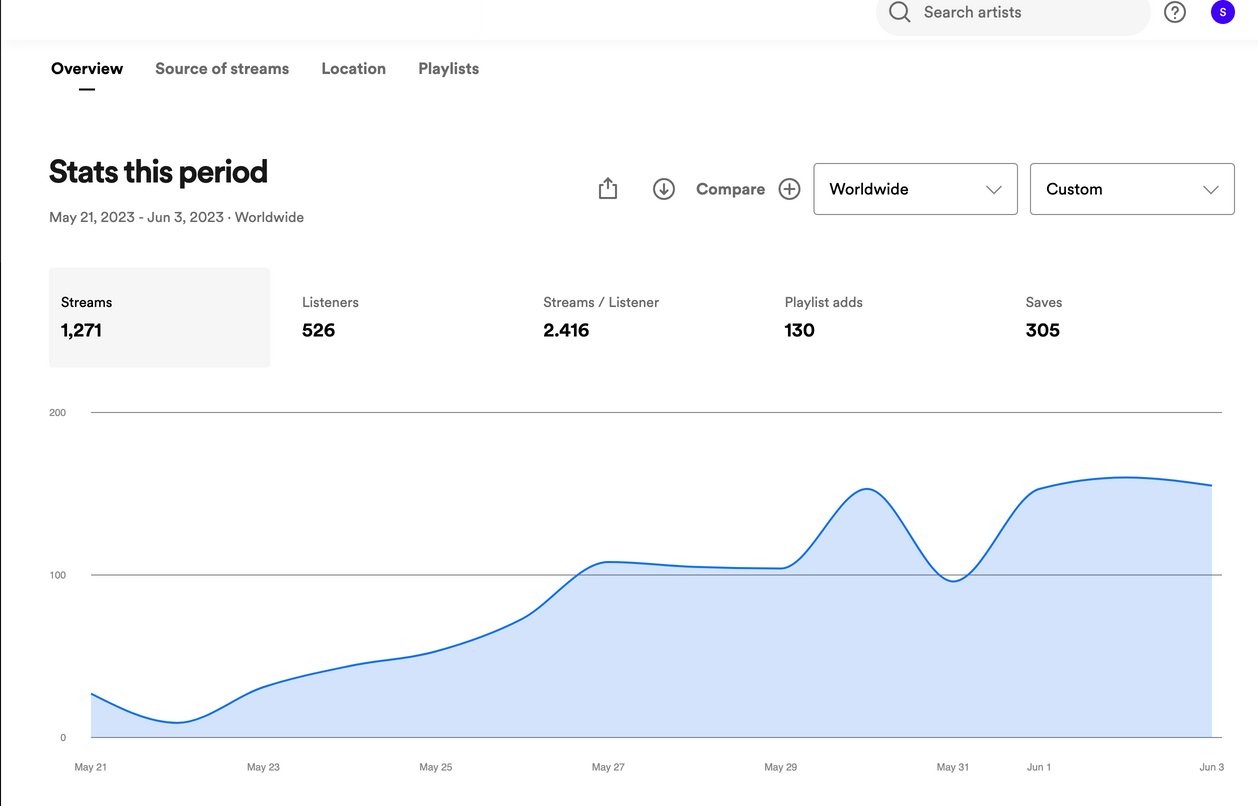
Spotify for Artists stats after two weeks
Week two, 1,271 streams
Meta ads manager results after one month
Month one, ad set expansion
Spotify for Artists stats after one month
Month one, 4,425 streams
Meta ads manager campaign overview
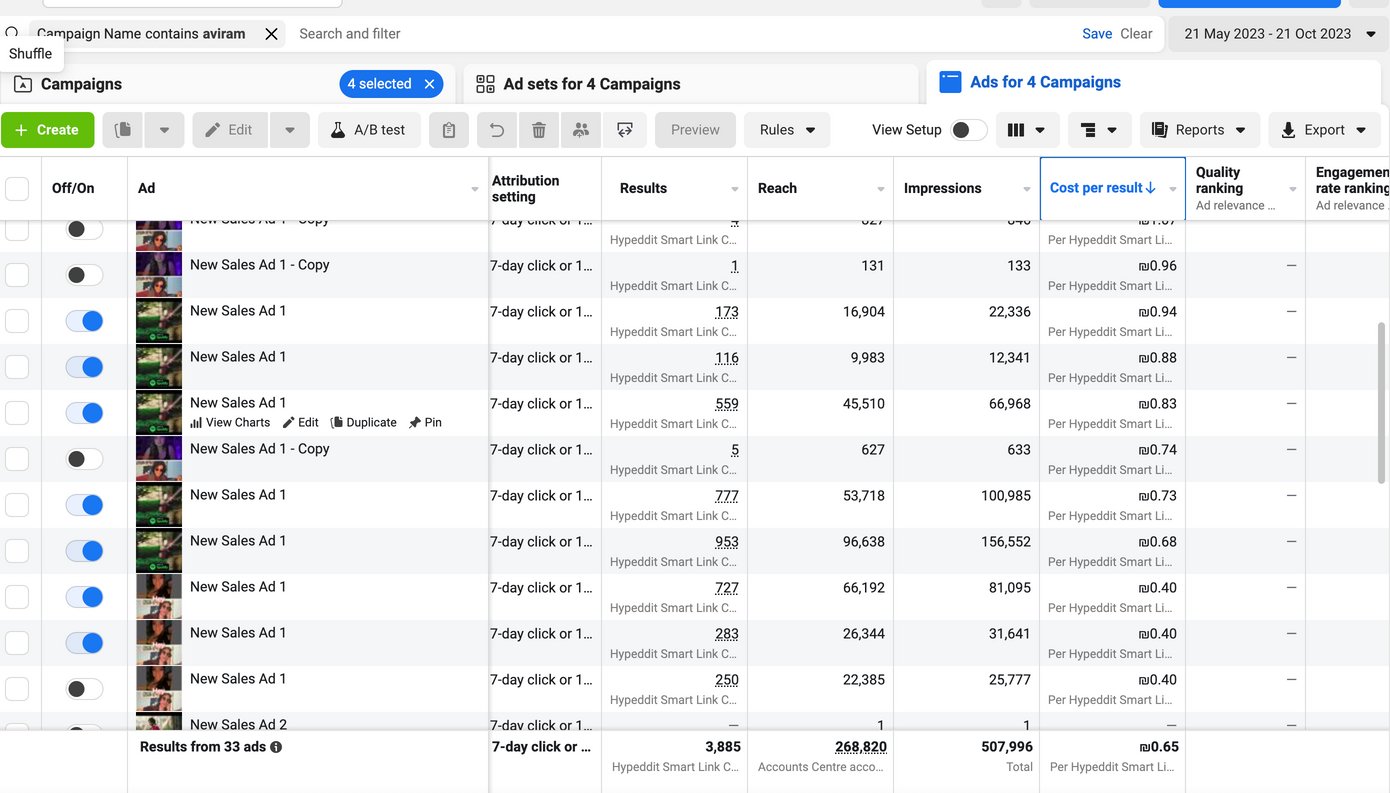
Campaign view across four campaigns
Spotify for Artists stats after five months
Five months, 122,939 streams
Spotify for Artists twelve month stats
Twelve month view
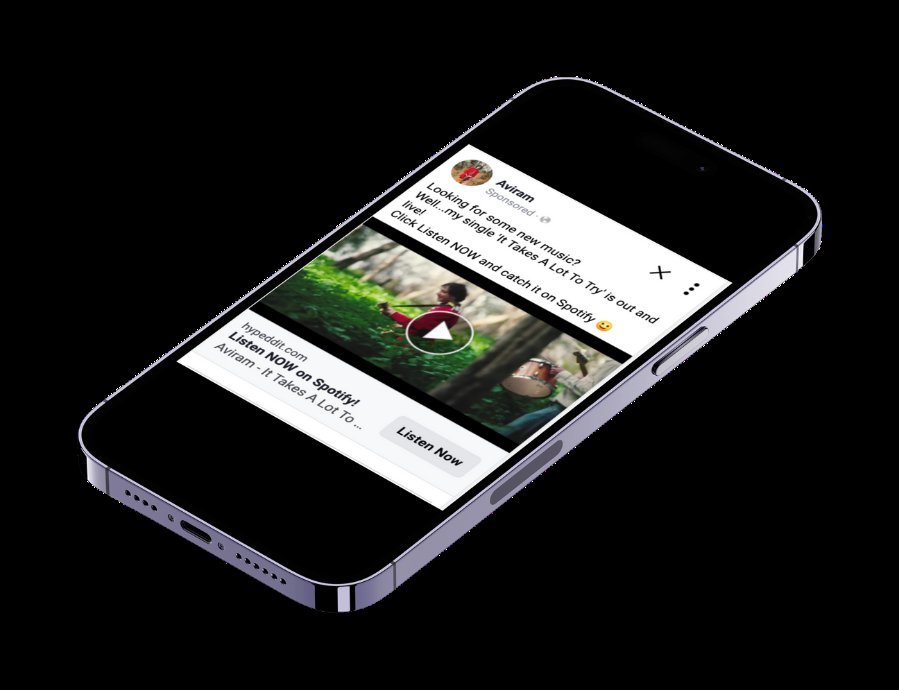
Instagram ad creative on a phone
Creative in feed
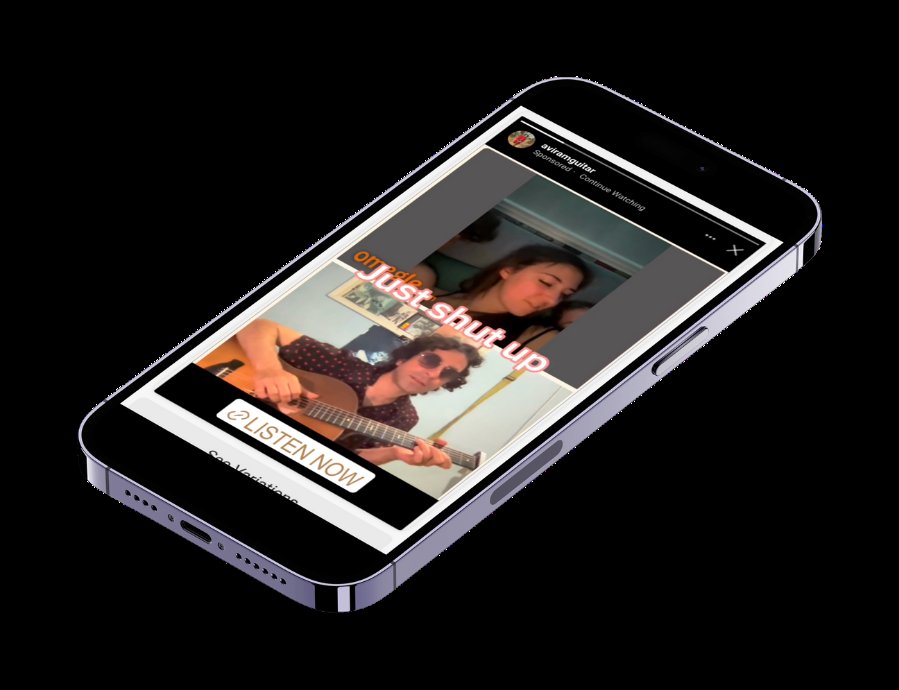
Second ad creative on a phone
Creative variant

How the campaign ran

01

Seed

Small daily budget on Meta, aimed at the streaming profile

02

Test

Creatives and audiences rebuilt every week

03

Compound

Winning sets scaled as cost per stream dropped

04

Verify

Every claim read back in Spotify for Artists

Open the full breakdown

Beau Cruz portraitConversion campaign

Caffeine (Espresso Martini)

Beau Cruz

242,675 streams in three and a half months at fourteen cents a click

PromoteConvertRepeat

242,675

Streams

103,672

Listeners

$0.14

Cost per result

Launched

April 11, 2025

Budget

$1,097.81

Cost per click

$0.14

Platform

Spotify

The challenge

An upbeat nightlife dance track needed to behave like a playlistable anthem fast. Without early volume and engagement, dance releases stall before the algorithm ever notices them.

The approach

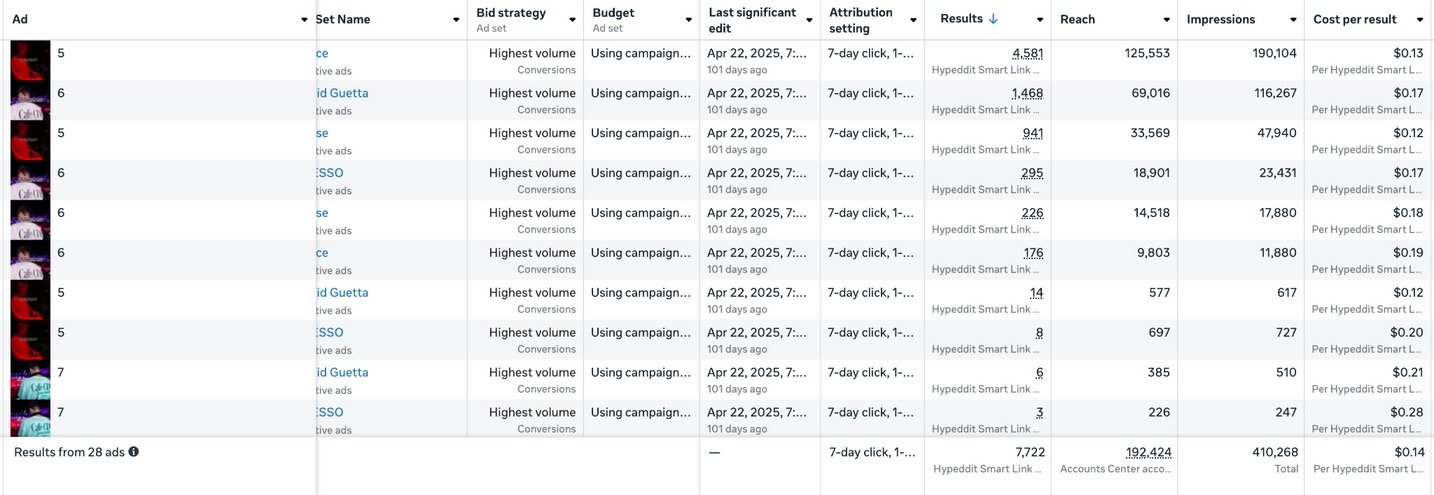
We built a Spotify conversion funnel: Meta campaigns for mass awareness, a smart link for click to listen intent, and engagement quality as the optimisation target. Twenty eight individual ads ran across four ad sets targeting Alesso fans, dance music fans, David Guetta fans and house music lovers.

The result

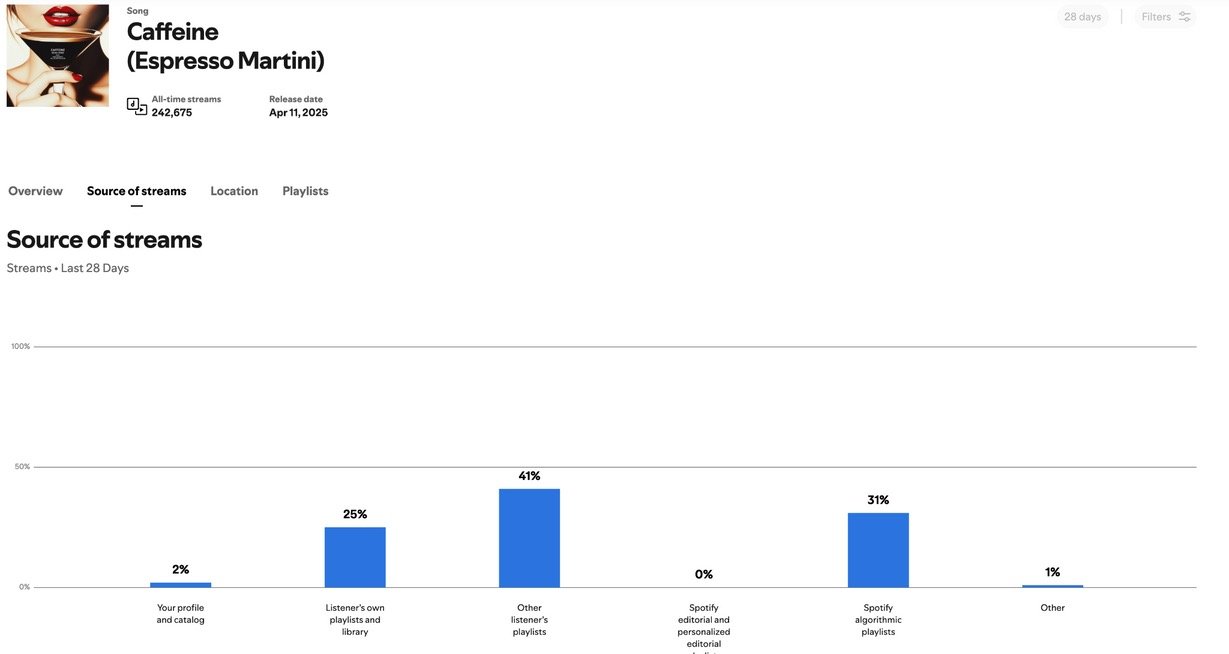
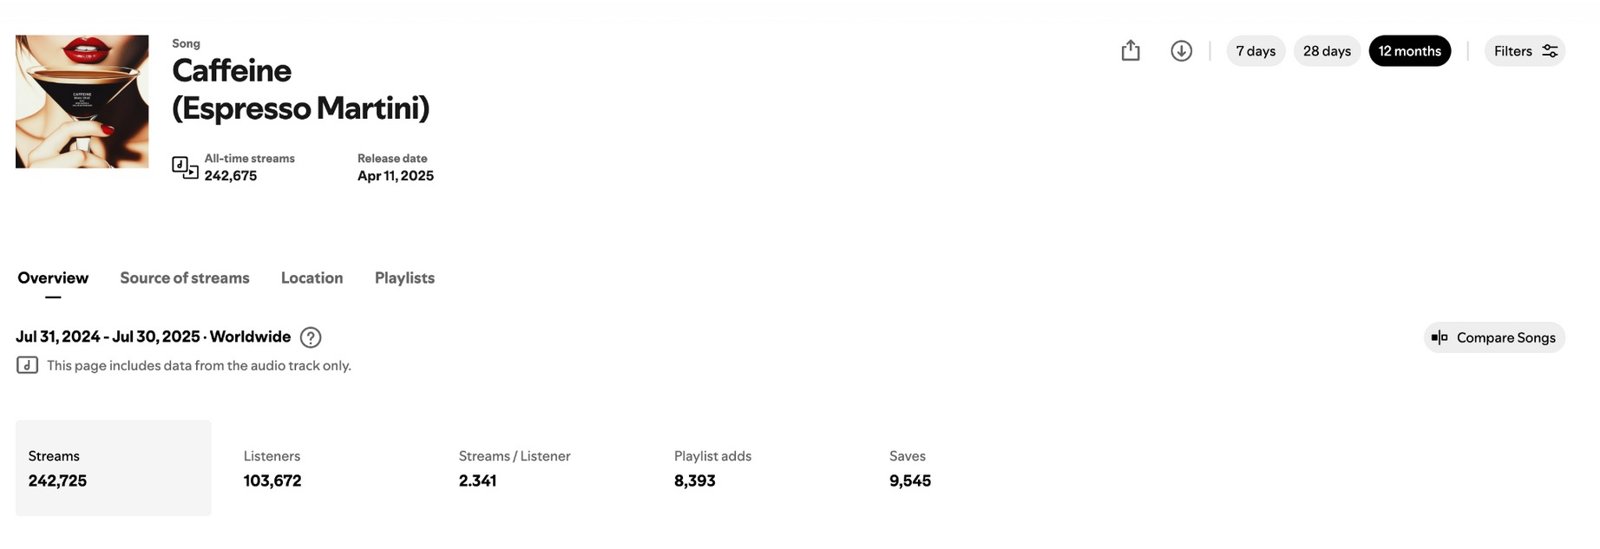
7,722 clicks from 192,424 reach at $0.14 per result, with the best ad delivering 4,581 results at $0.13. Spotify returned 242,725 streams, 103,672 listeners, 8,393 playlist adds and 9,545 saves, with 31 percent of streams coming from algorithmic playlists.

Straight from the campaign

Meta ads manager table for the campaign
Ad level results, 28 creatives
Spotify for Artists overview for Caffeine
Spotify for Artists overview
Source of streams bar chart
Where the streams came from
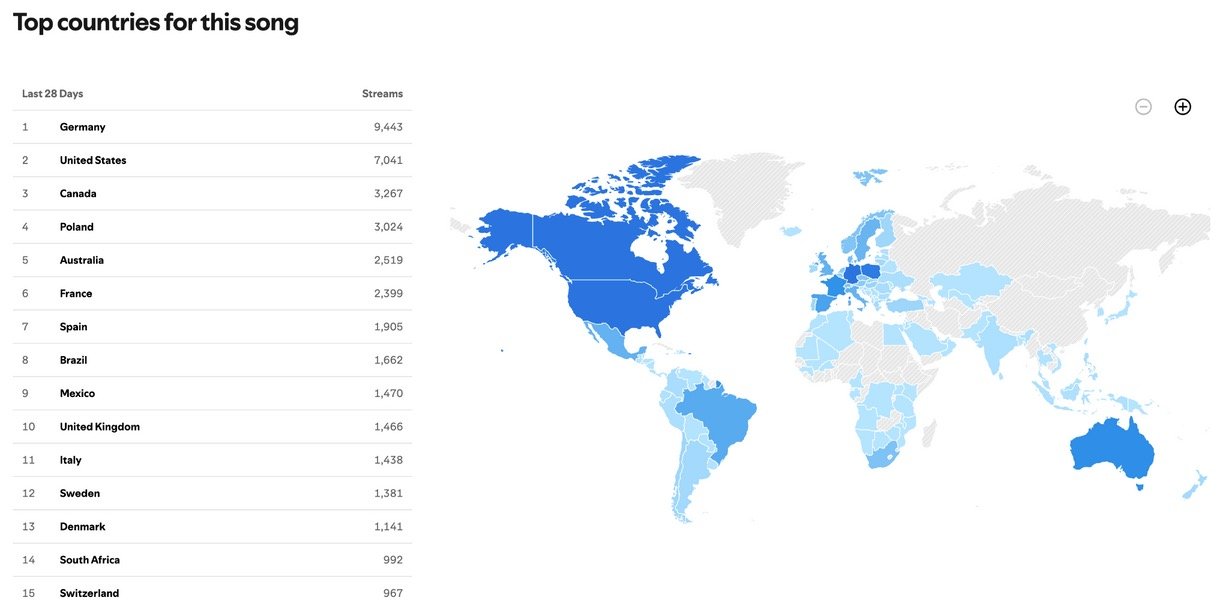
Map of top streaming countries
Top countries

How the campaign ran

01

Reach

Meta campaigns across four fan-based ad sets

02

Click

Smart link captures click to listen intent

03

Engage

Saves, adds and repeat plays optimised for

04

Algorithm

31 percent of streams came from Spotify playlists

Open the full breakdown
Portrait of John Elle in a white shirt on a yellow backgroundLong term growth

DJ and house producer

John Elle

150 million streams in a year from zero, with 77 percent coming from the algorithm

PromoteConvertRepeat

150M

Streams in a year

694,208

Playlist adds

27,811

Followers

Working since

June 2023

Daily budget

$20 to $50

Algorithmic share

77 percent

Platform

Spotify

The challenge

A house producer starting from nothing, with daily budgets of twenty to fifty dollars. The goal was not a spike on release week but a growth curve the algorithm would keep feeding long after the ads paused.

The approach

Hyper A/B testing on paid social to bring qualified off platform traffic to Spotify first, then carefully timed playlist placements around it. Overusing placements too early is the most common mistake we see: it suppresses the algorithm instead of triggering it.

The result

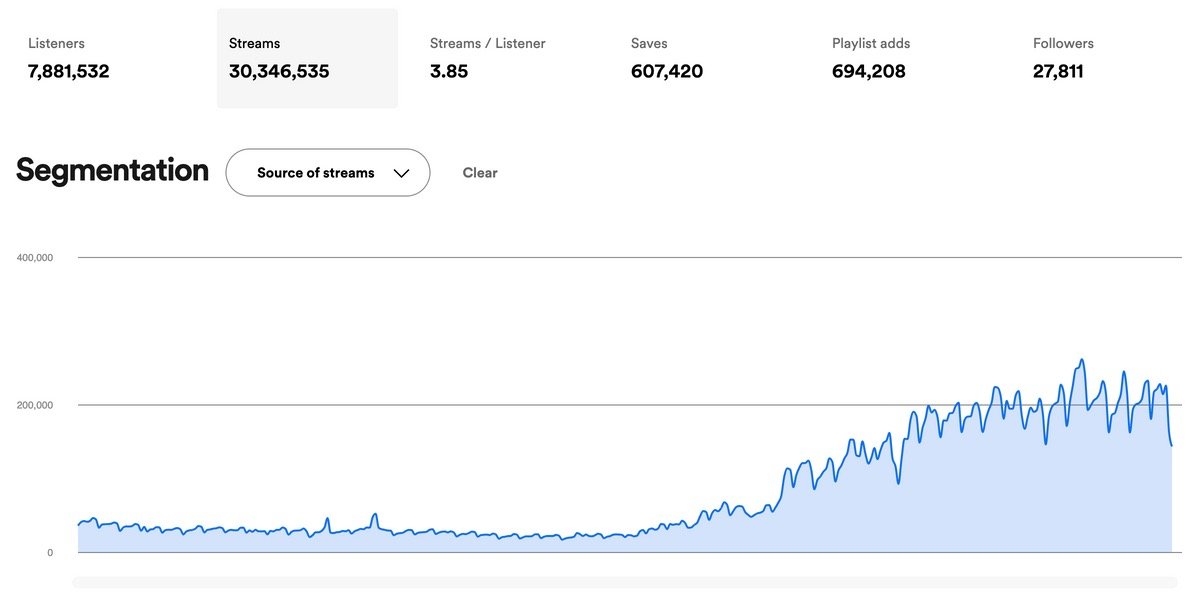
150 million streams in twelve months from a standing start, 607,420 saves, 694,208 playlist adds and 27,811 followers, with 77 percent of streams arriving through Spotify algorithmic sources.

Straight from the campaign

Spotify for Artists segmentation chart
Twelve months of Spotify growth
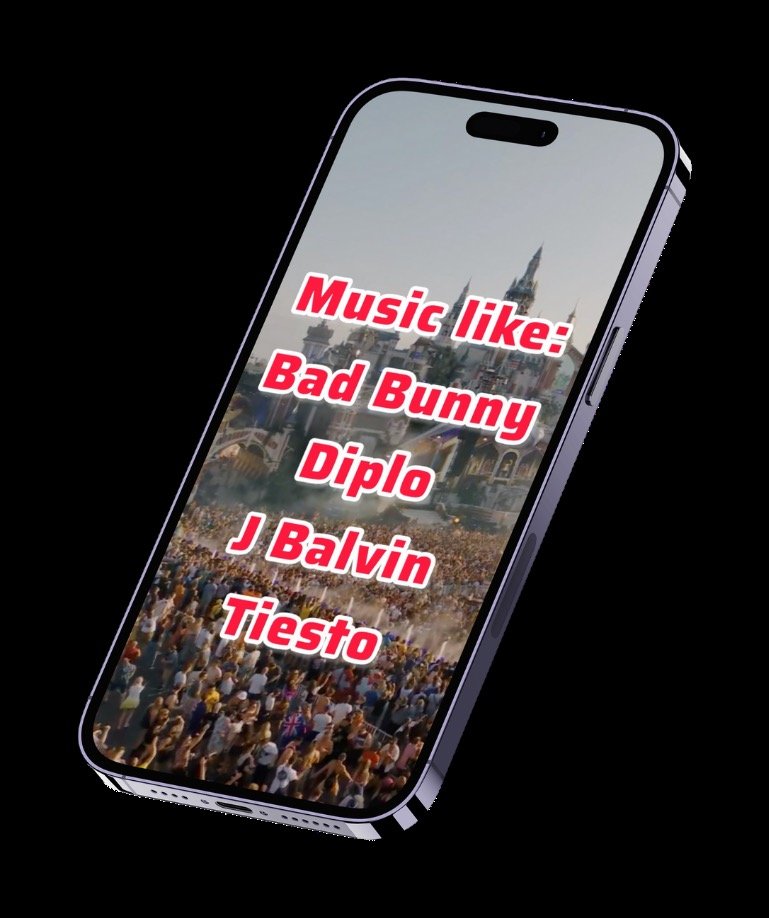
Ad creative on a phone naming similar artists
Creative variant, genre hook
Ad creative on a phone about latin house music
Creative variant, scene hook

How the campaign ran

01

Traffic

Paid social sends real listeners to Spotify first

02

Filter

Custom audiences built on interaction quality

03

Time

Placements sequenced so the algorithm is triggered, not blocked

04

Sustain

77 percent of streams keep arriving algorithmically

Open the full breakdown
Talk to us about your release

Your release could be next

Tell us where you are and what you are releasing. We take on a limited number of artists and labels, and we read every application ourselves.

Apply to Work With Us

We read every application personally and reply within 48 hours.